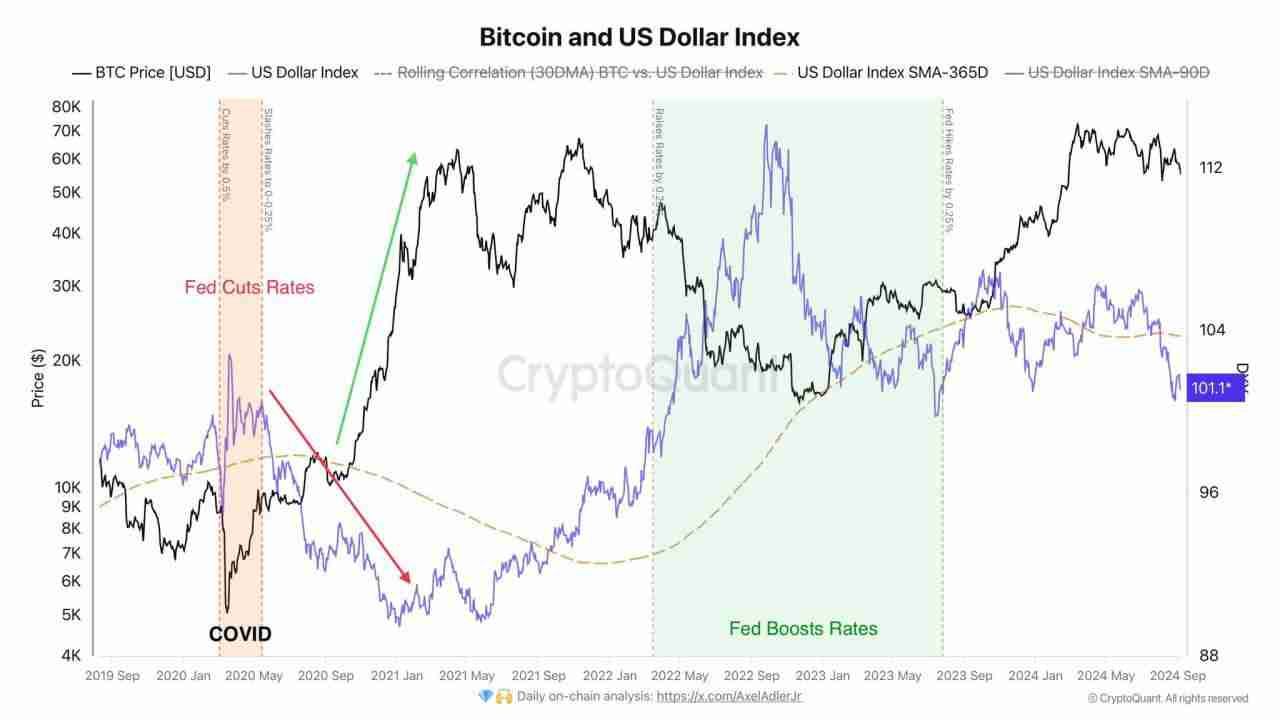
A weaker dollar makes BTC more attractive to investors. A Fed rate cut will weaken the dollar index, potentially leading to a new rise in the price of bitcoin🚀🚀🚀
#BITCOIN DAILY TF UPDATE :
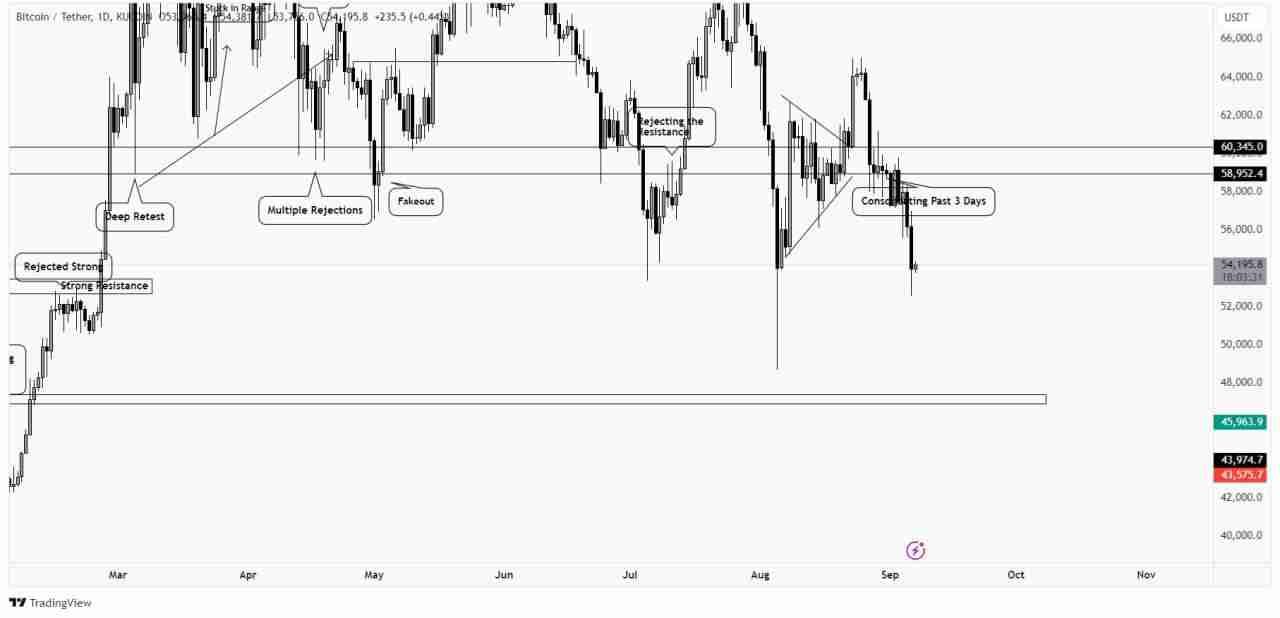
#BITCOIN on Daily TF, Daily candle close below and we saw some sharp decline lower and reaching out $52,500 area. This can be a wick fill and looks at the market, its kinda go more lower just for liquidity run.
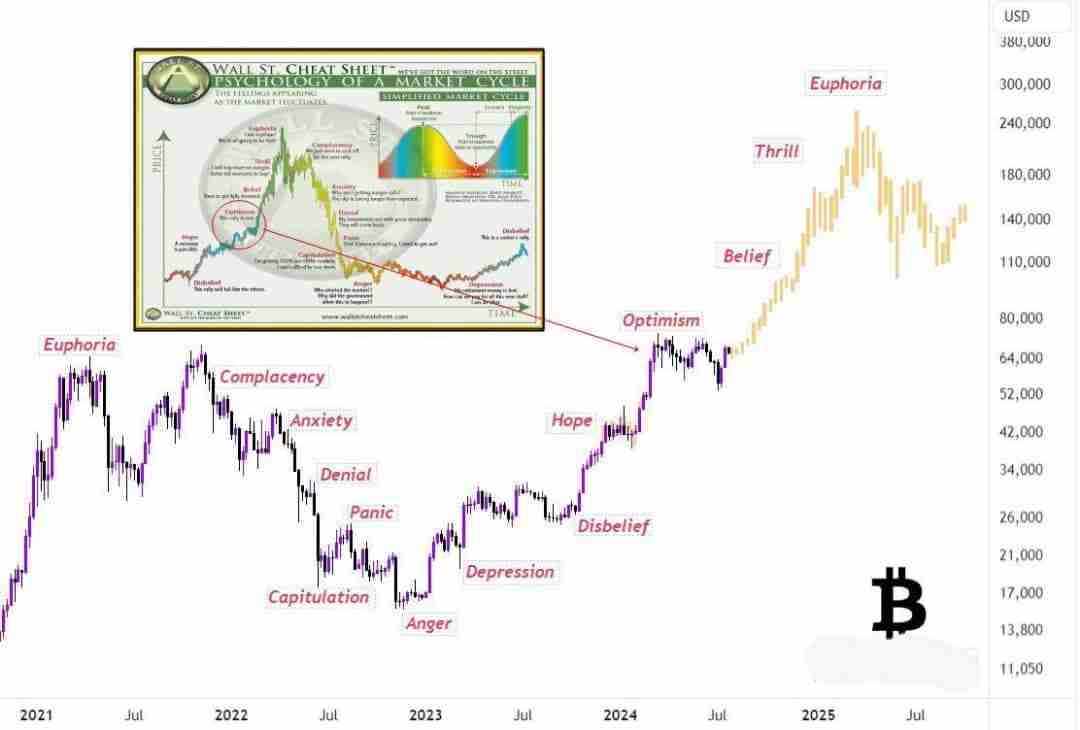
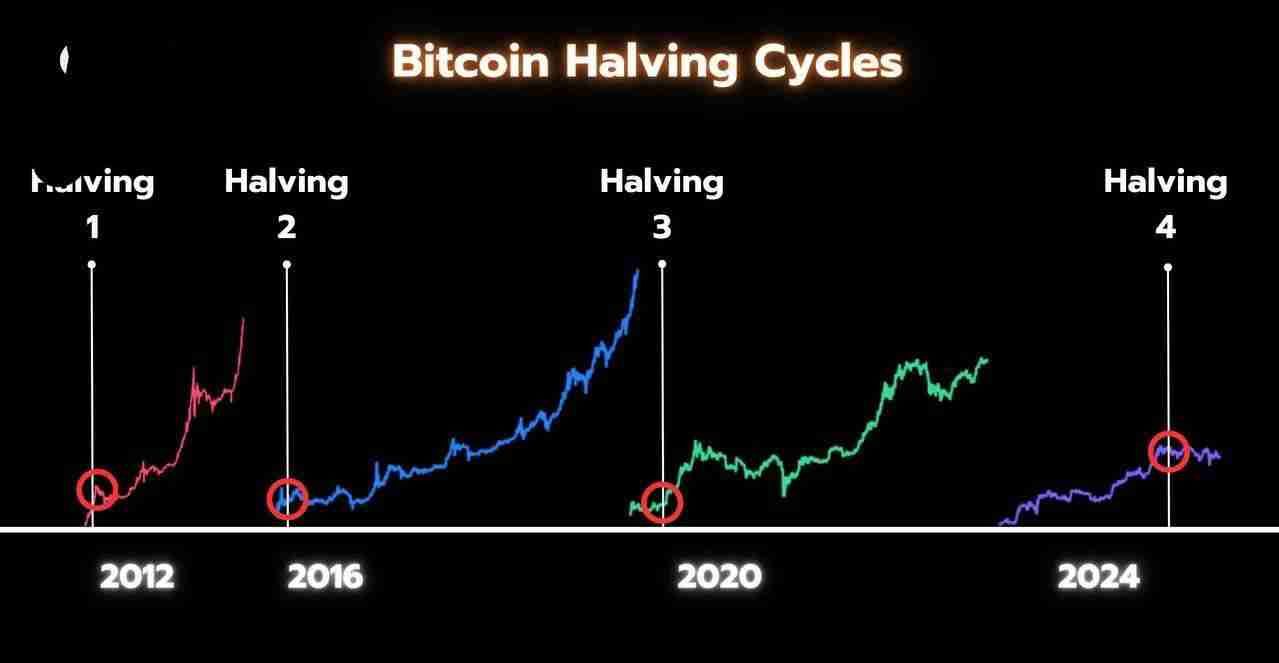
This Bitcoin cycle is no different.
The biggest gains are still yet to come
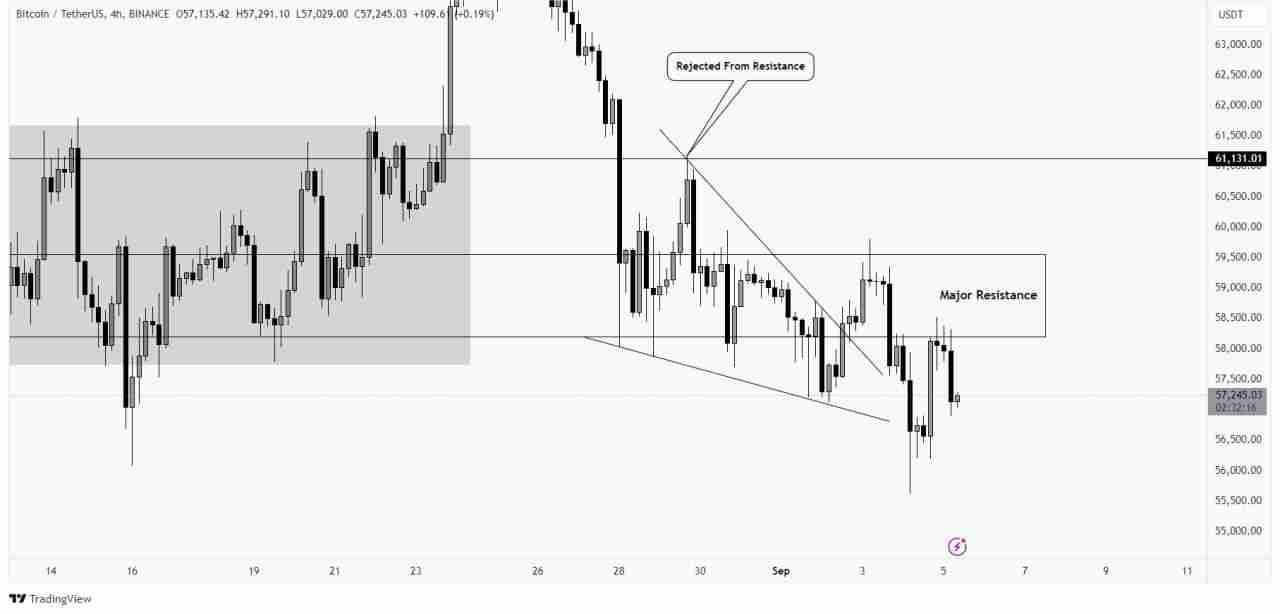
#BTC attempted to move back to the resistance area getting rejected again. The zone is standing very strong, as long as price trading below it, we might see more dump in altcoins.
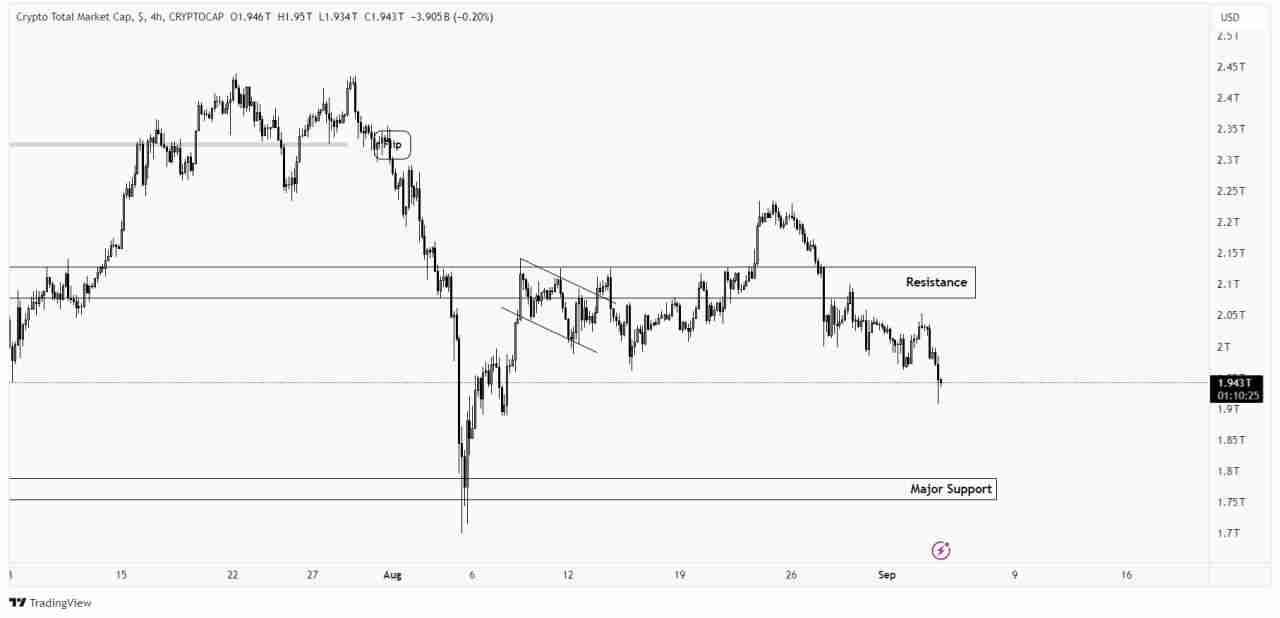
#TOTAL MARKET CAP :
#TOTAL Marketcap gave a closing over the resistance respecting the pattern and again slides below it. Now, this is the new range and market can dip further lower too. Potential reversal points will be $1.80T - $1.85T.
#BTC Finally gave a break of the resistance area and gave a healthy closing in Daily TF. Now, in H4 TF price looking for a retracement and expected to continue moving higher.

💸BTC Won't Wait for Trump
Peter Schiff, although often groundlessly spreading bearish sentiments, made a good point:
"If Donald Trump really planned to use the confiscated BTC to inject into US reserves, he would not have talked about it before taking office. Now the Biden administration will sell all BTC before November."
It makes sense to be. +1 factor to pressure on the price of bitcoin 😨
In total, the US government has 13 billion bitcoins on its balance sheet.

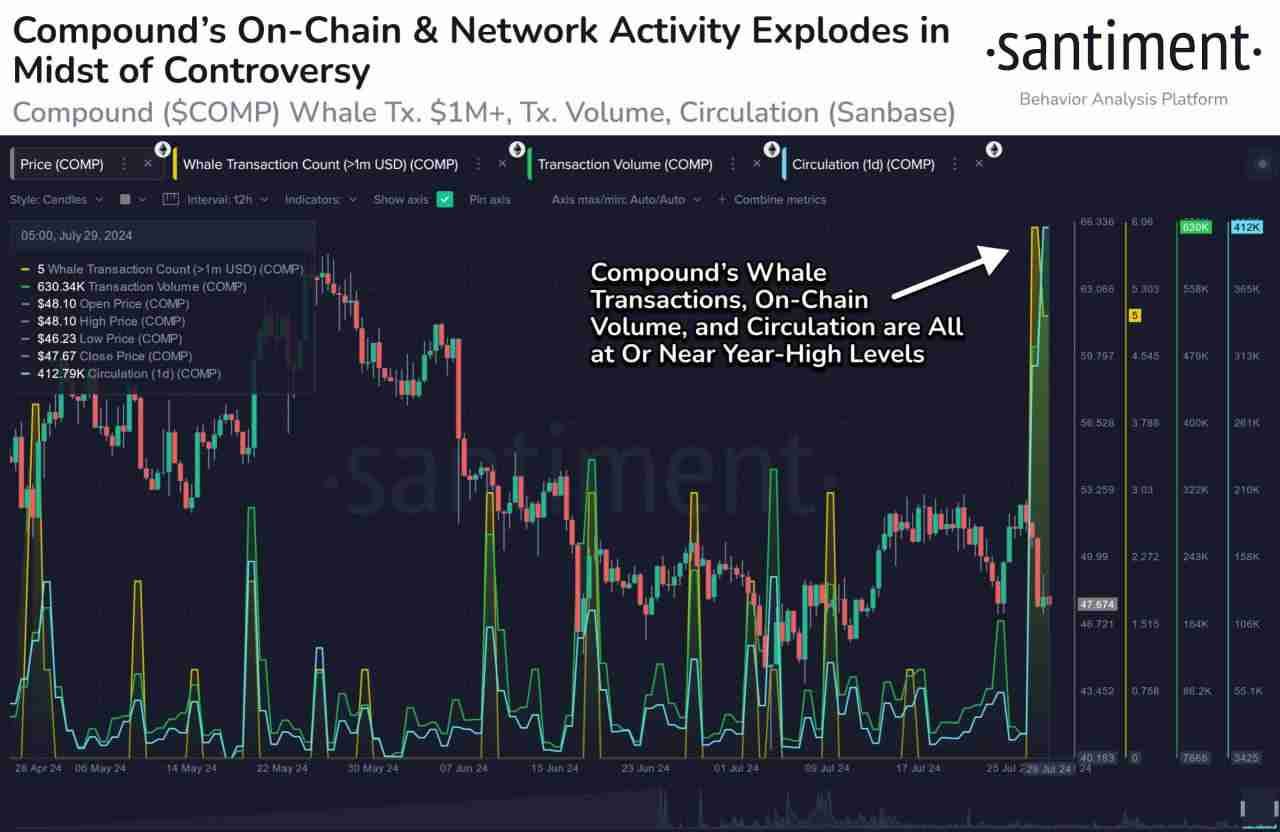
📊After a poor vote that saw several questionable initiatives passed, the Compound community’s trust in the project has begun to wane. With a huge increase in discussions thanks to informative posts, our metrics show on-chain activity has grown to its highest level in a year.
👉Expect key metrics like whale transactions, turnover, and more to continue to look very polarized and prices volatile as this story takes center stage in the COMP and altcoin community.
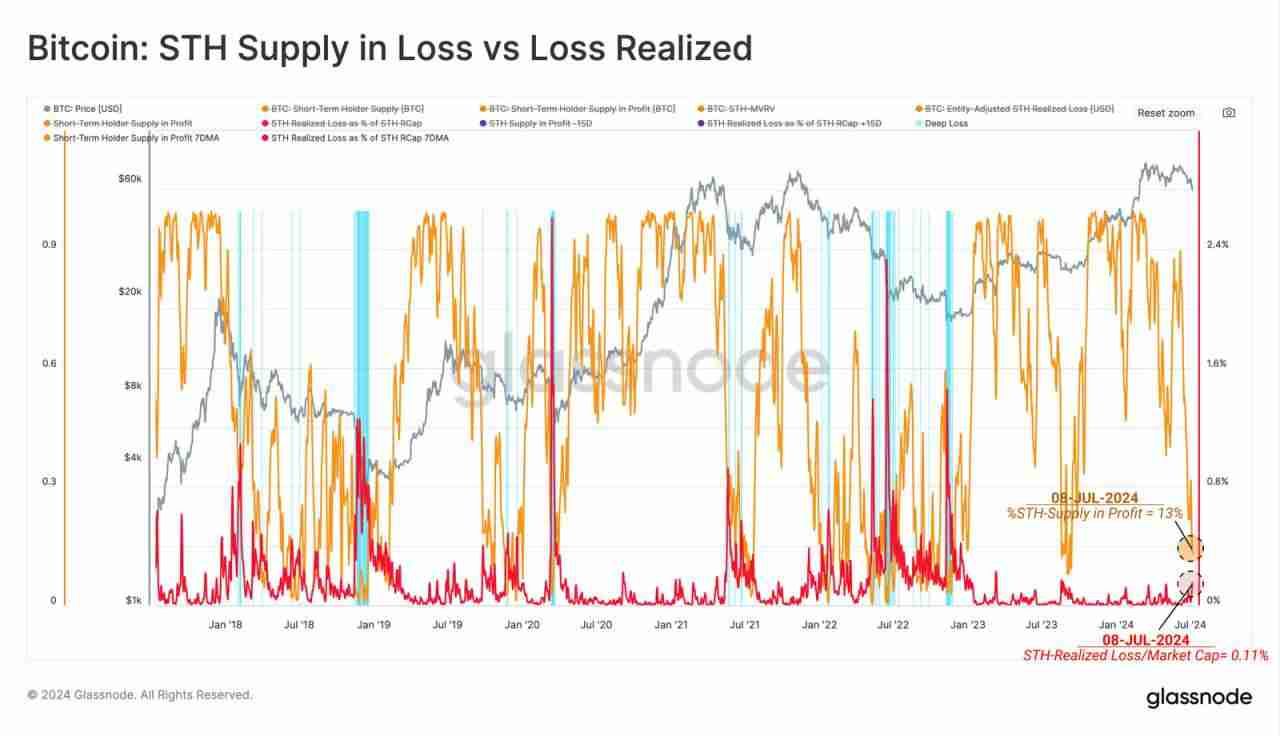
When STH losses are calculated as a percentage of total invested wealth (divided by STH Realized Cap), the picture changes. Relative losses for this group are typical compared to previous bull market corrections. The chart highlights periods where both percent of STH Supply in Loss and magnitude of losses exceed 1 standard deviation from the mean.
