#SCRT/USDT
Secret Network is finally on the verge of a massive breakout from its descending channel👀
If the pattern plays out as expected, we could see a significant bullish wave incoming🌊
A successful breakout might propel price towards targets at $0.27, $0.33, $0.39, and $0.52, potentially offering a 120%+ gain✈️

#ACH/USDT
Alchemy Pay has bounced off the support zone and is now approaching the trendline on the 2-day timeframe🧐
A breakout above this trendline could lead to significant upward movement📈
Potential targets for $ACH if the breakout is confirmed:
$0.0225, $0.0270, $0.0330, and $0.0385🎯

#BTC/USD
Bitcoin is struggling to break above the 100 MA at $60.7k on the daily chart🔍
This is the second attempt, showing strong resistance at this level🧐
A breakout above $60.7k could pave the way to $68k-$69k targets🚀
Rejection might lead to a bearish scenario📉

#LTO/USDT
LTO Network is approaching a potential breakout from a symmetrical triangle formation🔍
A successful breakout could trigger an 80-100% bullish wave in the midterm📈
Keep an eye on possible targets at $0.14, $0.17, and $0.22 if the breakout is confirmed🎯

#RIO is forming a Huge Head & Shoulders formation on weekly timeframe🔥
This low cap #RWA gem is about to go to 2 digits🚀

#OM/USDT is bull flagging above the ATH resistance zone👀
Looking for 2$, 3$, & 4$ targets to be hit📈
$OM is another #RWA gem btw🤫

VOLATILITY AHEAD
FOMC Today At 11:30 Pm (IST), High Volatility Ahead⚠️
I'll Update You The Result Here Exactly At 11:30 Pm (IST), Just Unmute Channel And Stay Tuned!

💰 #ADA/USDT
Falling Wedge with a fakeout below the red key zone (served as a supply for W-Bottom and now is a demand zone)🧐
Bullish scenario in case we have a confirmation - breakout through the confluence of EMA 50 + EMA 100 + EMA 200 + 0.236 fib📈
🎯 Targets
0.618 fib - 0.8590$
0.786 fib - 1.0335$

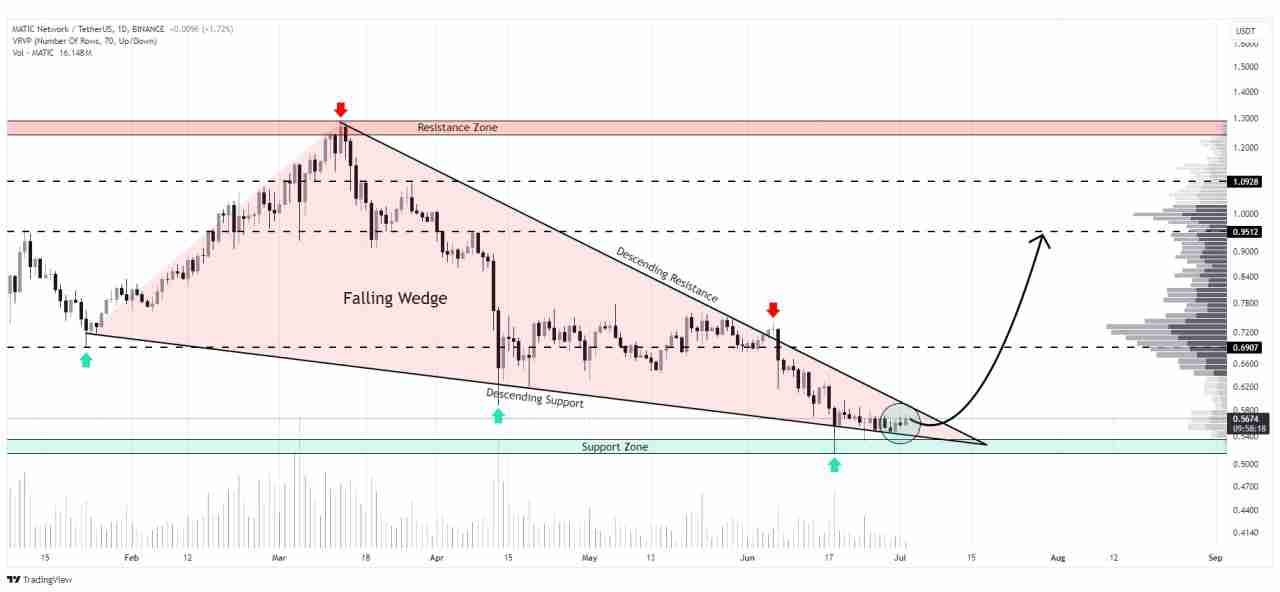
#MATIC/USDT
Accumulation phase observed near Falling Wedge support on daily chart🧐
Breakout could trigger 80% bullish wave in coming weeks🌊
Increased trading volume could signal start of upward move📈
#DOT/USDT
Falling Wedge pattern forming on the 12-hour chart, signaling a potential bullish move🧐
Anticipating a breakout from the pattern's upper boundary📈
Target zones could be previous resistance levels🎯
